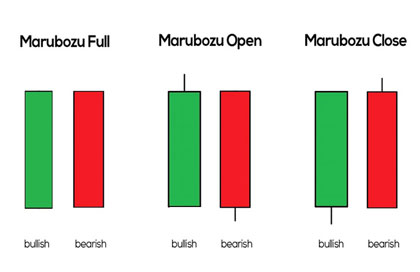
Marubozu
The Marubozu candlesticks are easily identified by their appearance. The bearish Marubozu is usually denoted by a red, whereas the bullish Marubozu denoted by Green.
ChartSpeakz is a trading gateway for Swing trading and short term Investment decision making. Our skilled and qualified technical analysts sharing accurate and high convictional Stock Market views for traders / investors.
We are certified professional and skilled technical analysts doing a deep technical research in the market by analyzing price action using chart patterns, candlestick patterns and Harmonic Patterns and then providing technical views of the future possible movement to our customers.
We share our technical views on stocks through Whatsapp, Telegram and Twitter etc,.
Candlestick charts were first created by Munehisa Homma, a Japanese rice trader.. In the 1700s, the charts gave Homma and others an overview of open, high, low, and close market prices over a certain period. This style of charting is very popular due to the level of ease in reading and understanding the graphs.
By analyzing two or more candlesticks, one can forecast the future direction of price movements.
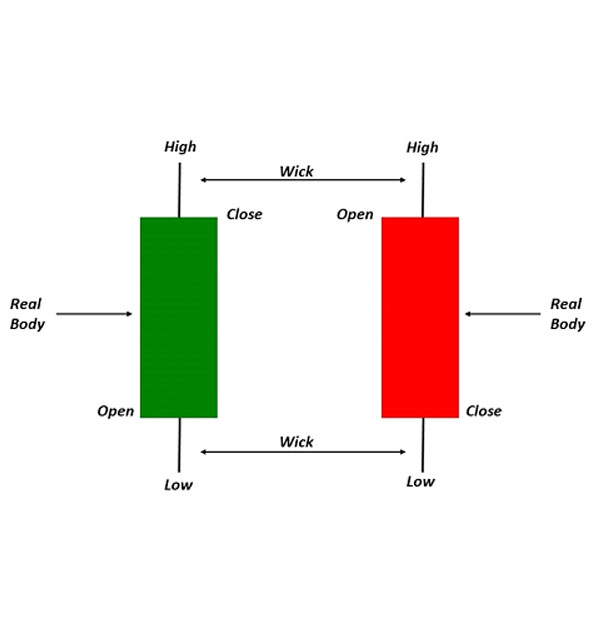
Each candle represents the range of prices during a particular time period. When the real body is Red, it means the close was lower than the open. If the real body is Green, it means the close was higher than the open.
By analyzing two or more candlesticks, one can forecast the future direction of price movements. Trading is often dictated by emotion, which can be read in candlestick charts.
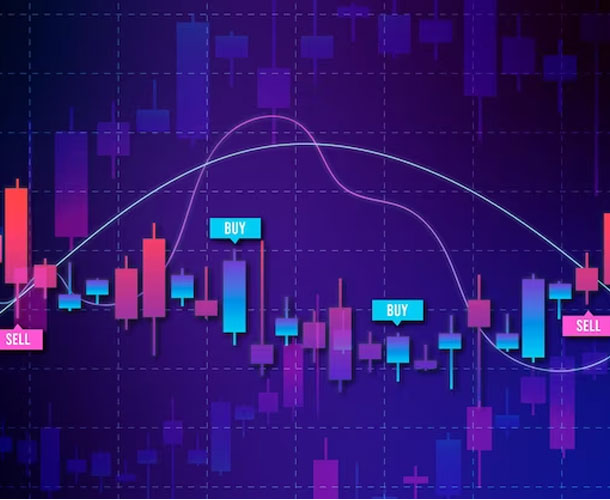
Both the bullish and the bearish candlestick patterns are more reliable when they appear near market extremes as indicated by trend lines, support, resistance and moving averages.
The Marubozu candlesticks are easily identified by their appearance. The bearish Marubozu is usually denoted by a red, whereas the bullish Marubozu denoted by Green.
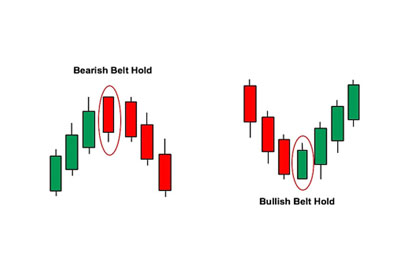
The Belt-Hold candlestick pattern is considered a minor trend reversal pattern that can indicate a bullish or bearish trend reversal, depending on the nature of the pattern.
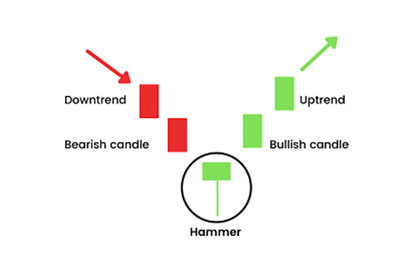
The bullish hammer is a significant candlestick pattern that occurs at the bottom of the trend. A hammer consists of a small real body at the upper end of the trading range.
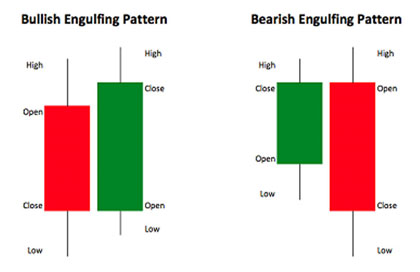
Engulfing candles tend to signal a reversal of the current trend in the market. This specific pattern involves two candles with the latter candle ‘engulfing’.
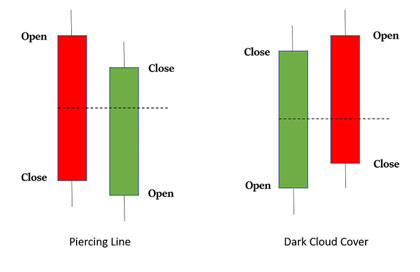
A piercing pattern is a candlestick pattern formed near the support levels, and it gives us potential bullish reversal signs. It is found towards the end of a downtrend.
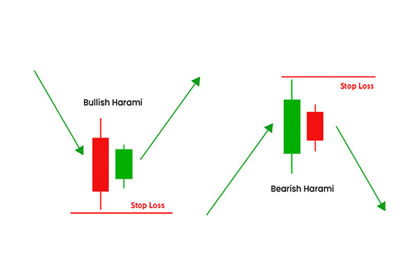
Harami means “pregnant” in Japanese. The first candlestick is seen as the “mother” with a large real body that completely enclosing or embodies.
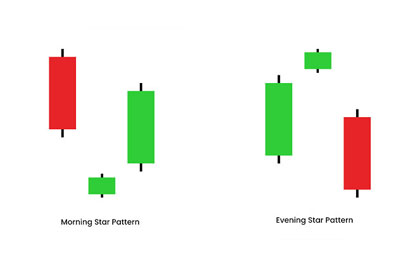
The morning star is a bullish reversal pattern that occurs at the bottom of a downtrend. As loke other candlestick patterns, it only signals a potential reversal.<