Harmonic Trading

Harmonic Trading

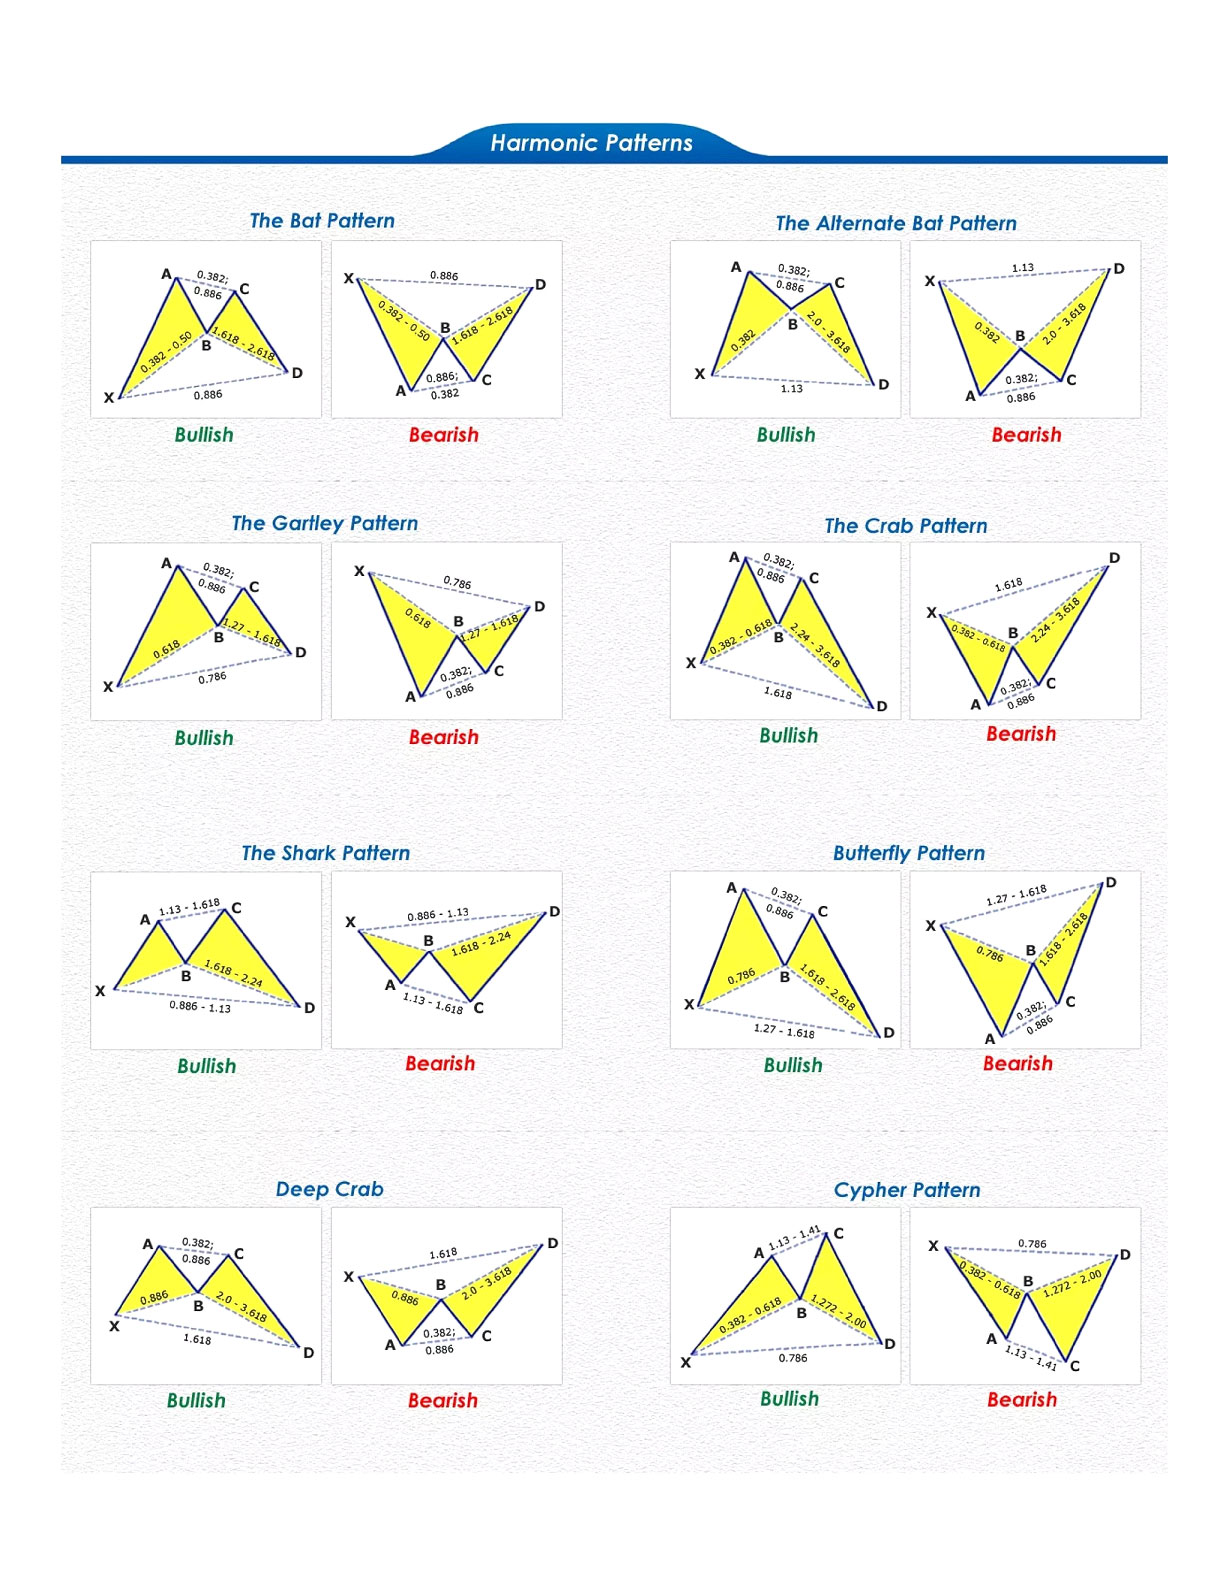
Harmonic patterns are one of the most efficient and effective trading patterns. Although they are more complex than other patterns, they can assist technical analysts in interpreting more price action information in the markets.  Harmonic patterns represent specific formations that arise frequently in price charts.

They help traders understand price action and predict price direction. In addition, these patterns are used to identify trend reversals.  so that traders can initiate a trade with a high probability of success.

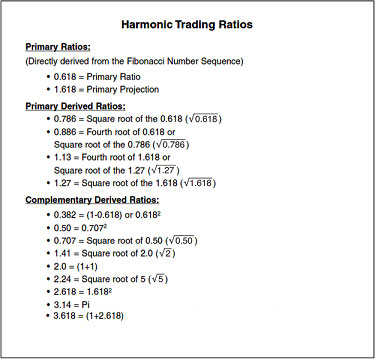
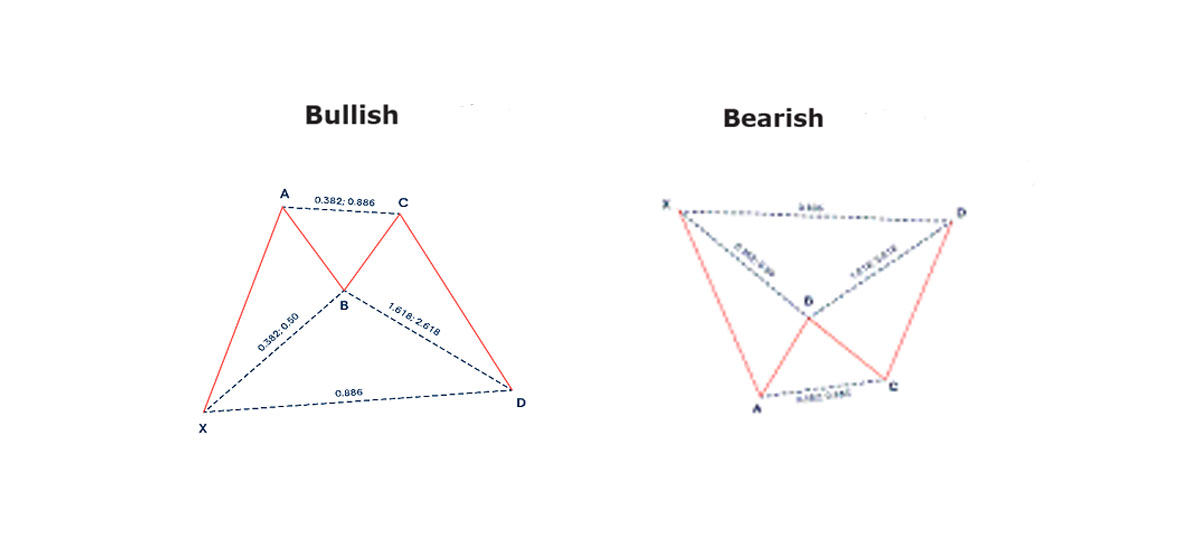
The pricing movements of different harmonic patterns can have different Fibonacci ratios. Harmonics traders look for certain sequences of Fibonacci retracements and extensions to occur in a particular order, a pattern, before they enter a trade. 

Fibonacci retracements and extensions are used to identify potential reversal zones. Where there is a high probability that the price will reverse.

Fibonacci Numbers

Harmonic patterns rely on the Fibonacci numerical sequence and ratios that are derived from the sequence begins with 0+1=1, 1+1=2, 1+2=3. Repeatedly applying this algorithm results in the following: 0, 1, 1, 2, 3, 5, 8, 13, 21, 34, 55, 89, 144,….

By finding patterns of varying lengths and magnitudes, the trader can apply Fibonacci ratios to the patterns and try to predict future movements. The trading method is largely contributed by Scott Carney.

Harmonic patterns can gauge how long current moves will last, but they can also be used to isolate reversal points. The danger occurs when a trader takes a position in the reversal area and the pattern fails.

When this happens, the trader can be caught in a trade where the trend rapidly extends against them. Therefore, as with all trading strategies, risk must be controlled.

Fibonacci Ratios

Certain key Fibonacci ratios include 61.8%, 38.2%, and 23.6%.

The 61.8% ratio is found by dividing one number in the sequence by the number that follows it. For example, 21 divided by 34 equals 0.6176, and 55 divided by 89 equals 0.61797.

The 38.2% ratio is derived by dividing a number in the sequence by the number located two positions to the right of that number. For instance, 89 divided by 233 equals approximately 0.38197.

The 23.6% ratio is found by dividing a number in the sequence by the number that is three positions to the right of that number. For example, 21 divided by 89 equals about 0.23595.

blog-img

How do Harmonic Patterns Work?

Harmonic patterns work by combining patterns and mathematics. This trading method is precise and based on the assumption that patterns repeat themselves. The primary theory behind harmonic patterns is price/time movements, which complies with the Fibonacci ratio relationships.

The Fibonacci ratio analysis works exceptionally well and you can use it on any timeframe chart. The main idea of Fibonacci is using the key ratios (0.618 or 1.618) to identify the main turning points, retracements, and extensions on a chart. These can also help you to identify the swing high and swing low points.

The projection and retracement levels that are derived using the high and low swing points will give you key price levels that you can place both your stops and targets. Harmonic patterns can indicate potential price movements and key reversal or turning points. This can give you a major advantage because these patterns can give you very accurate entry, stop loss and target levels.

In Harmonic, the most popular pattern is XABCD:

   ⦁ (XA) is a move, where point (X) is the start of the trend and (A) is its top;

   ⦁ (AB) is trend retracement, and (B) marks the retracement extreme;

   ⦁ (BC) is trend extension with the peak at point (С);

   ⦁ (CD) is an ending move.

blog-img

There are many different harmonic patterns: Bat, Gartley, Crab, Butterfly, Shark, Cypher. All of them are visually very similar and it is difficult to see the difference between them at first. Harmonic patterns, as well as all chart patterns, can be conditionally divided into two types: Bearish and Bullish. 


Advantages & Disadvantages of Harmonic Patterns

Advantages:

   ⦁ Provide future projections and stops in advance, making them leading indicators.

   ⦁ Frequent, repeatable, reliable and produce high probable setups.

   ⦁ Trading rules are relatively standardized using Fibonacci ratios.

   ⦁ Work in all timeframes and in all market instruments.

   ⦁ Other indicator theories (RSI, MACD) can be used along with them.

Disadvantages:

   ⦁ Complex and highly technical, making it difficult to understand.

   ⦁ Correct identification and automation (coding) of harmonic patterns is difficult.

   ⦁ Conflicting Fibonacci retracements/projections can create difficulty in identifying reversal or projection zones.

   ⦁ Complexity arises when opposing patterns form from either the same swings or other swings/timeframes.


Popular Harmonic Patterns:

There are multiple chart patterns to choose from, each of which can be used to spot a different kind of trend. However, it is important to note that before following any pattern, you should be confident in your ability to perform your own technical analysis, so that you are always able to make the best – and the fastest – trading decisions.

Here we will discuss about TOP 10 Harmonic patterns.

   ⦁ The ABCD pattern

   ⦁ The ALT BAT pattern (0.382%)

   ⦁ The BAT pattern (0.500%)

   ⦁ The Gartley pattern (0.618%)

   ⦁ The Butterfly pattern (0.786%)

   ⦁ The Crab pattern (0.382% - 0.618%)

   ⦁ The Deep Crab pattern (0.886%)

   ⦁ The Shark pattern (Anywhere between O and X )

   ⦁ The Cypher Pattern (0.382% - 0.618%)

   ⦁ The 5-0 Pattern (---------------------)

https://www.scribd.com/document/512358960/Harmonic-Trend-Patterns-Cheat-Sheet

blog-img